Loading...

Optics and Music
Optics and Music
Optics and Music
Bio-Phase Research
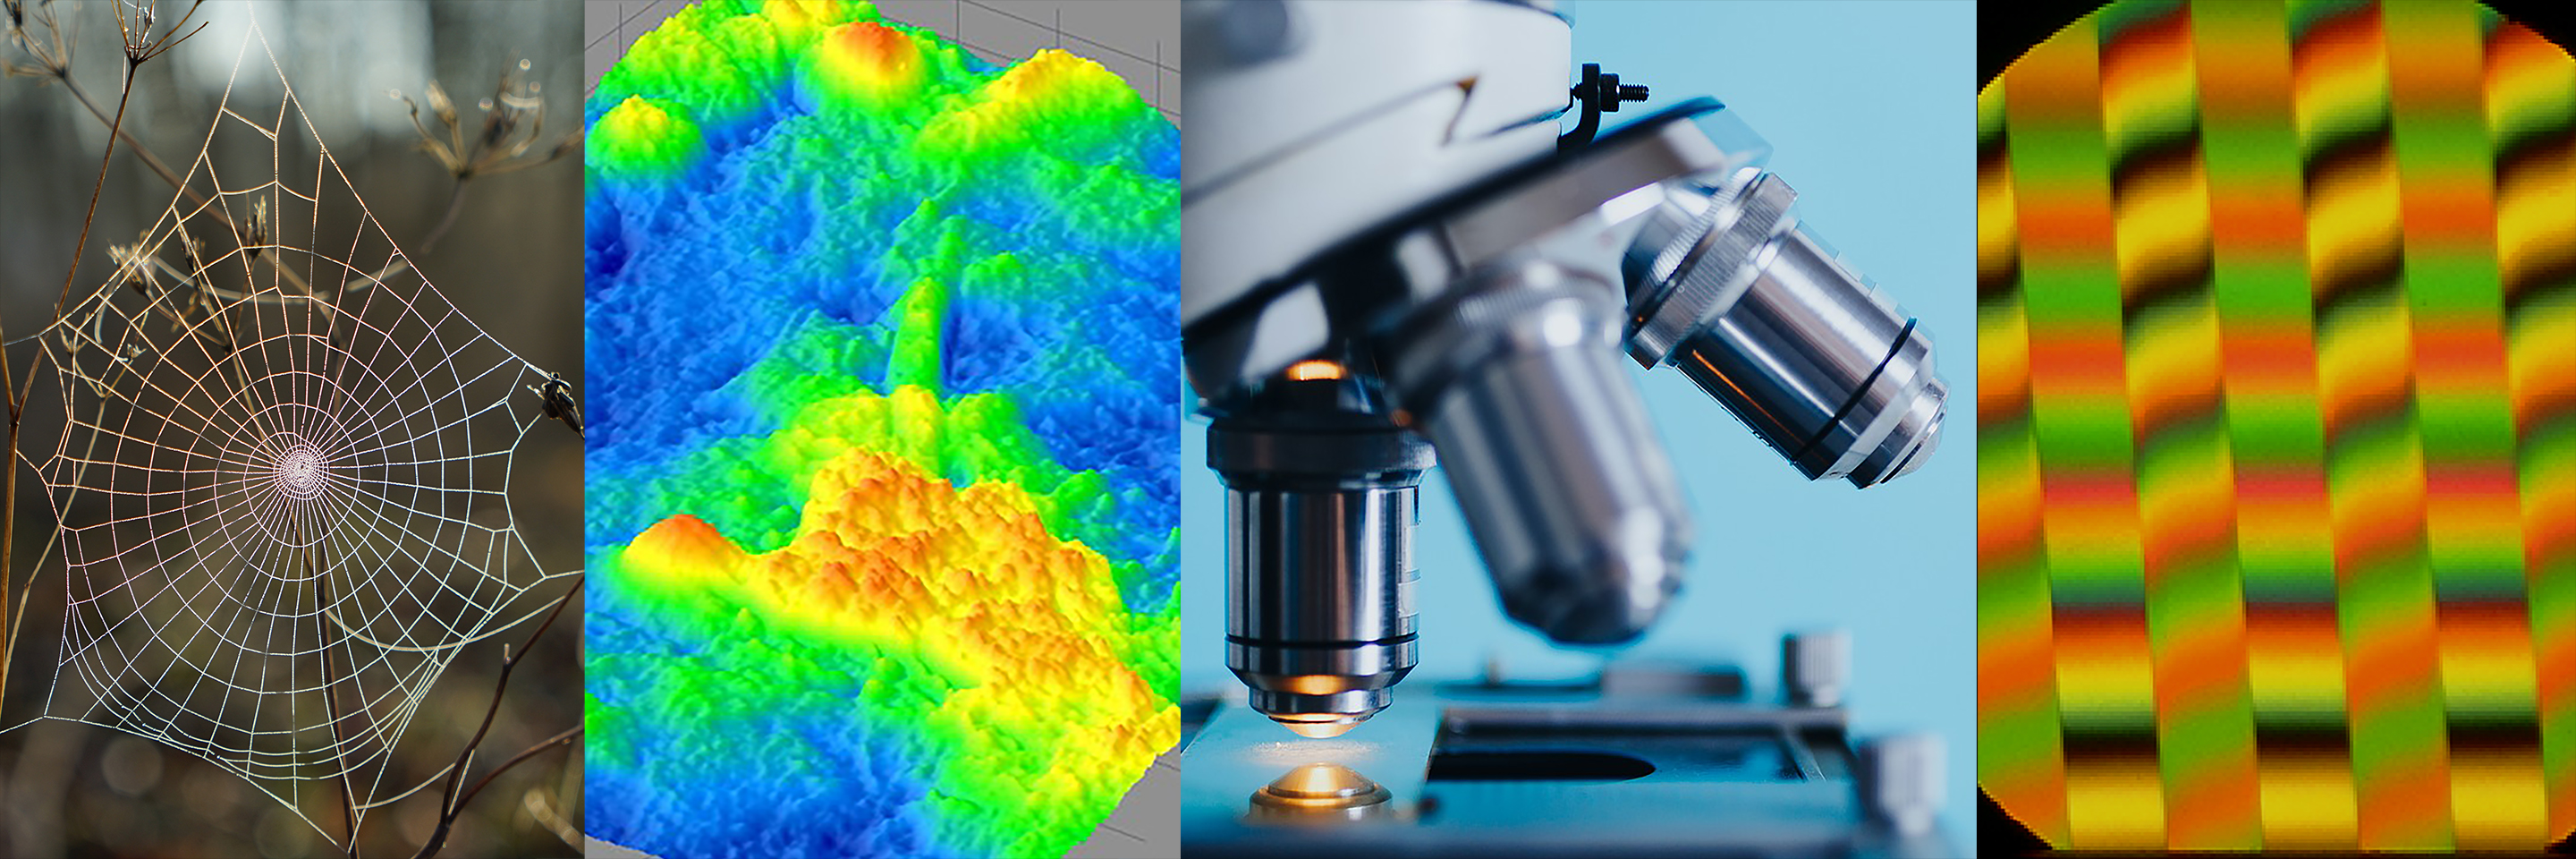
Bio-Phase Quantitative Imaging Microscopy
From 2009-2014, I was PI on a NIH Phase I & II SBIR with 4D Technology Corporation to develop a bio-phase imaging system based upon a Linnik interference microscope using dynamic quantitative phase-measuring microscopy (QPM) in real-time.
The animated image above shows real-time beating of live cardiac myocytes grown on a slide and imaged using the QPM described above. It was wonderful to discover that we could image these kinds of cellular contractions without the use of any toxic dyes or fluorescent markers and watch cellular processes with minimal perturbation.
The middle movie shows the optical phase topography of a pond critter waving its cilia in water. It is trapped under a coversliip so it doesn't swim away.
The bottom movie shows the optical phase thickness of a swimming protozoa in real time.
My goal in these endeavors has been to work toward non-invasive imaging techniques to image and monitor cellular processes.
The selected articles below provide a good overview of the project. Scroll down the page to see more results, videos and listings of relevant articles.
Selected Articles:
• Creath, K., and Goldstein, G., "Dynamic quantitative phase imaging for biological objects using a pixelated phase mask," Biomedical Optics Express 3(9), (2012).
• Creath, K., and Goldstein, G., "Processing and improvements in dynamic quantitative phase microscope," Proc. SPIE 8589, 85891A (2013). describes system in more detail
Quantitative Phase Microscopy Results
Blood Flow in Live Zebrafish
Imaging of blood flow through the cardinal vein in a 3-day old live anesthetized Zebrafish at 15 fps. Colors indicate relative optical thickness. 511nm source, 40X magnification, and 33 x 44 micron field of view. Thicker/denser areas are red, and thinner/less dense areas are blue. [Co-Author: Goldie Goldstein; Zebrafish preparation by Maki Niihori, University of Arizona].
Oligodendrocyte Growth
Growth of oligodendrocytes at 1 frame per minute observing branching at the ends of processes. Colors indicate relative optical thickness. Thicker/denser areas are red, and thinner/less dense areas are blue. [Co-Author: Goldie Goldstein; Research partners: Jane Peppard et al., Sanofi-Aventis].
Membrane Ruffling and Vesicle Transport
[top] Myocyte growth with 10fps burst intervals over 1hr 20min at 40X with 511nm source and 211 x 211 micron area. Scaled to enhance membrane ruffling. Colors indicate relative optical thickness. [bottom] Vesicle transport in myoblasts with 511nm source, 40X, over 14 min. Thicker/denser areas are red, and thinner/less dense areas are blue. [Co-Author: Goldie Goldstein; Research partners: Jane Peppard et al., Sanofi-Aventis].
Myocyte Contractions Before and After Treatment
These movies show contracting rat cardiac myocytes imaged at 15 fps utilzing the Biocam. Colors indicate relative optical thickness. Thicker/denser areas are red, and thinner/less dense areas are blue. [Co-Author: Goldie Goldstein; Research partners Craig Weber, Jordan Lancaster, and Ron Lynch, University of Arizona].
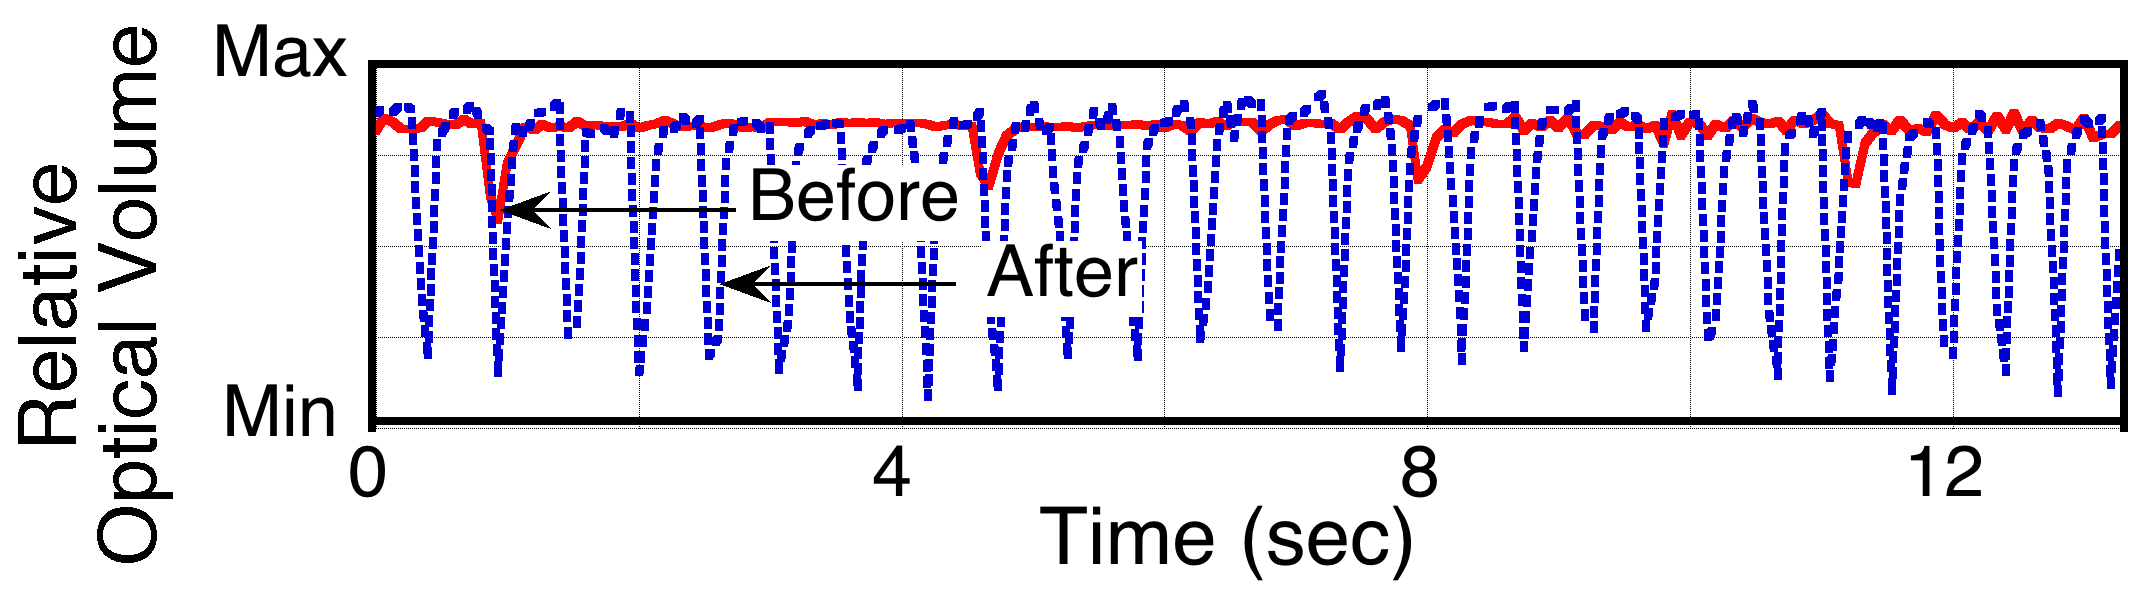
Plot showing relative optical volume of a rat myocyte culture beating before and after the introduction of isopreterenol. Note that both the changes in frequency and force of contractions can be easily discerned.
Epithelial Cell Images
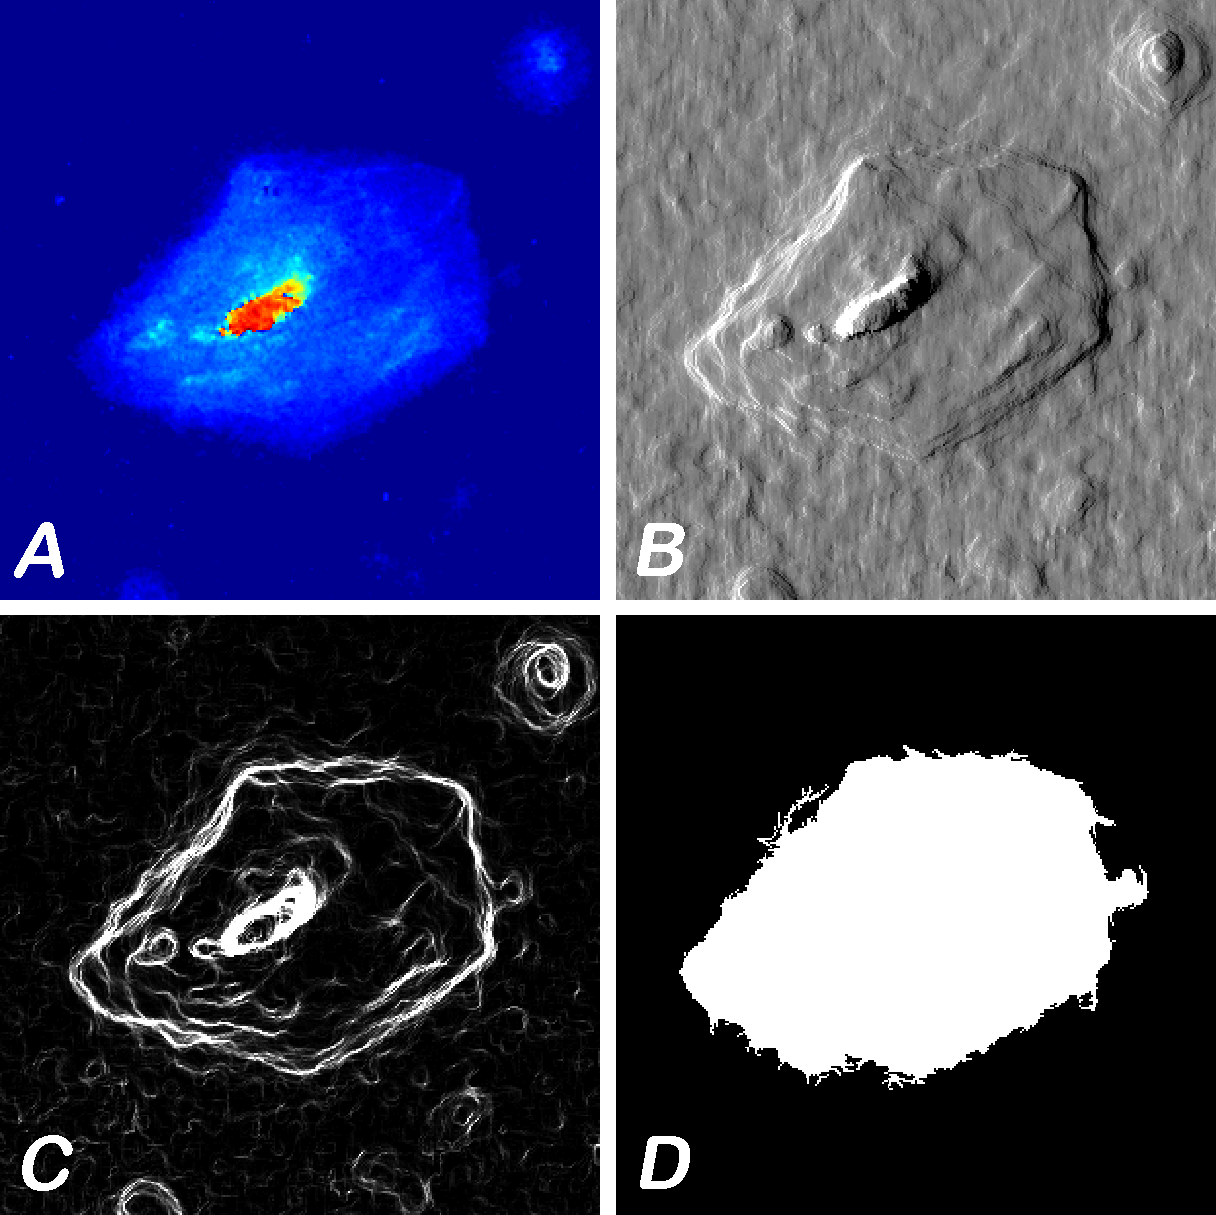
(A) Epithelial cell, (B) simulated DIC, (C) simulated dark field (gradient magnitudes), and (D) cell edges imaged on reflective slide at 40X. [Co-Author: Goldie Goldstein]
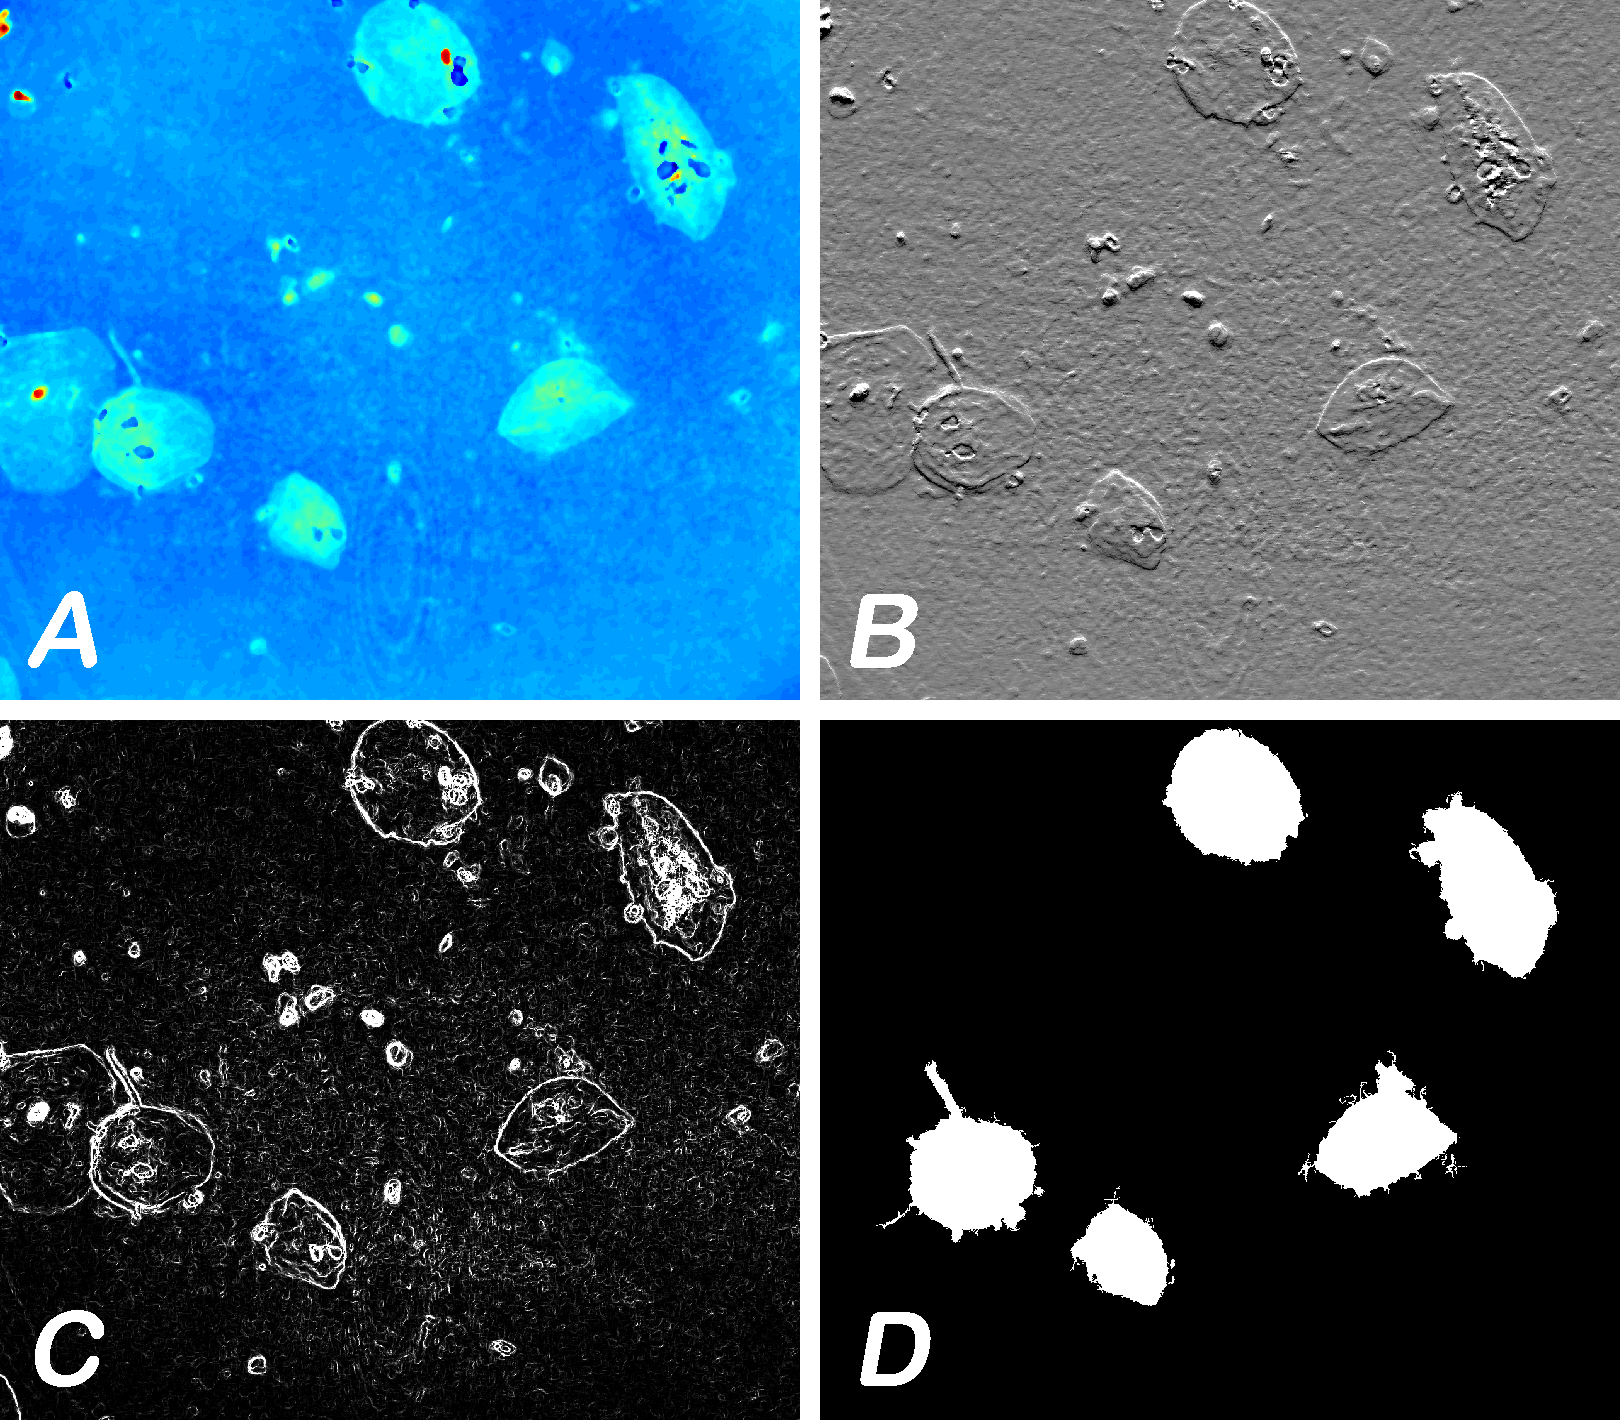
(A) Epithelial cells, (B) simulated DIC, (C) simulated dark field (gradient magnitudes), and (D) cell edges imaged on bare glass slide at 20X. [Co-Author: Goldie Goldstein]
Multiple Imaging Modes of a Protozoan in Motion
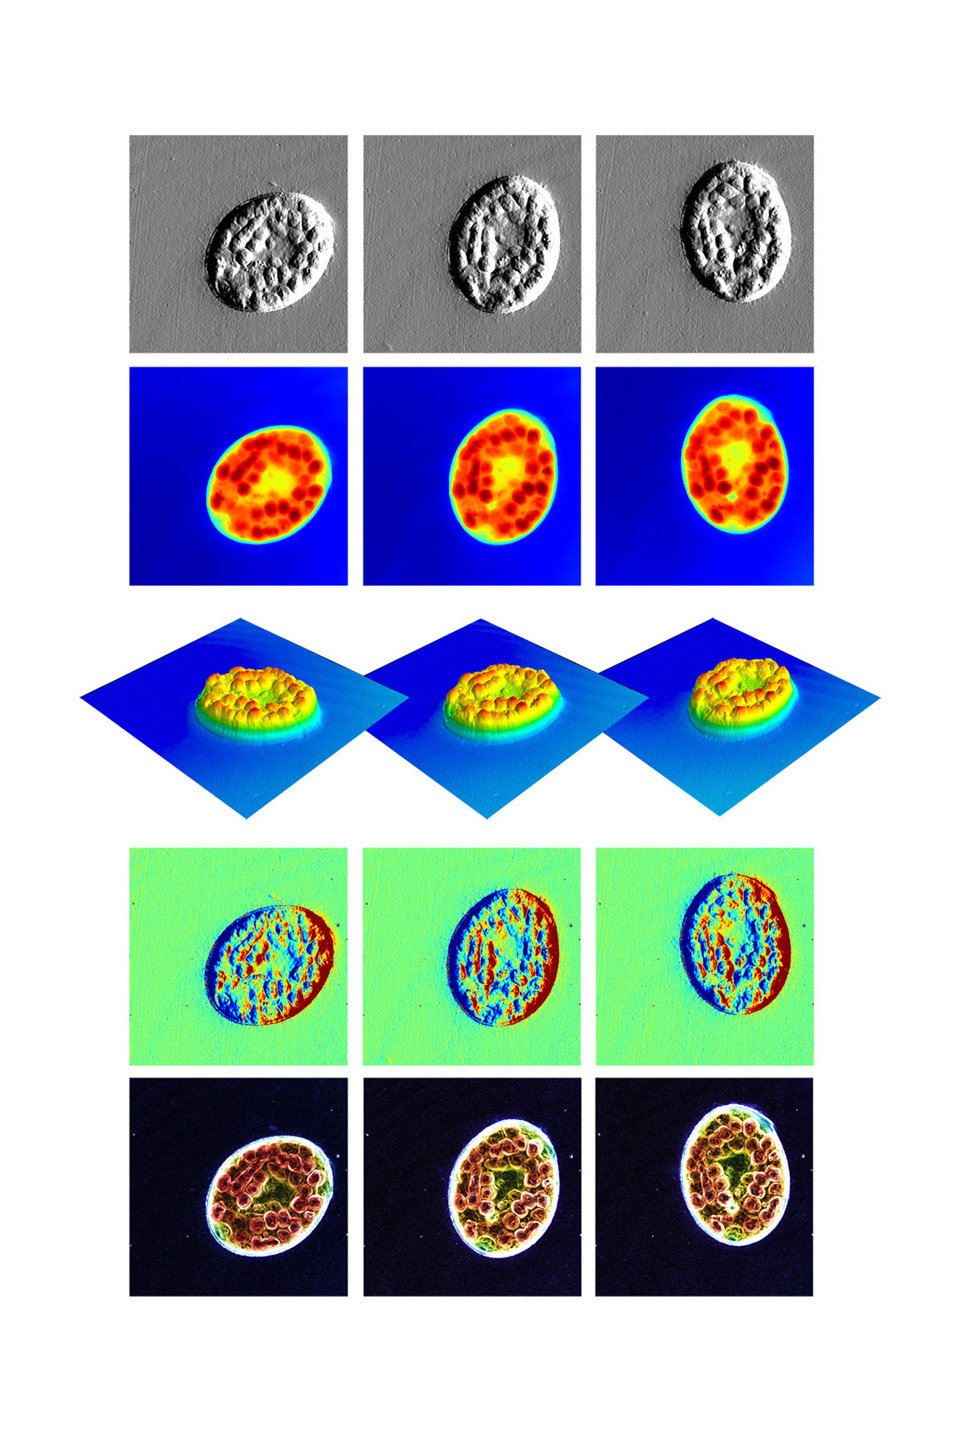
A nassula with engorged food vacuoles (bumps) as it moves through pond water.
Several imaging modes (shown top to bottom) highlight different aspects of the cell structure. A movie, created from a series of these images, quantifies the changes in the protozoan’s size, shape and structure over time. Three frames of that movie are shown for each imaging mode.
The nassula is 50x80 microns in size—roughly the width of a human hair.
BioCam Video
This movie gives an overview of the system developed through an NIH SBIR Phase II Grant. [Movie produced by Howard Letovsky, Letovsky Dynamics].
Further Information & Acknowledgements
This research focused on biological quantitative phase imaging utilizing interference microscopes. Please see my publications page for more published work.
Selected conference presentations:
Optical volume measurement of beating cardiac myocytes presented at Microscopy and Microanalysis 2013.
Quantitative Phase Microscopy: How to make data meaningful presented at SPIE BiOS 2014.
Quantitative BioImaging Utilizing Phase Microscopy, presented at GRC Image Science 2014.
Selected publications:
Creath, K., and Goldstein, G., "Dynamic quantitative phase imaging for biological objects using a pixelated phase mask," Biomedical Optics Express 3(9), (2012).
Creath, K., and Goldstein, G., "Processing and improvements in dynamic quantitative phase microscope," Proc. SPIE 8589, 85891A (2013). describes system in more detail
Creath, K., "Dynamic quantitative phase images of pond life, insect wings and in vitro cell cultures", Proc. SPIE 7782, 77820B (2010). earliest paper on this technique
Other results
can be found at my blog 4D Biocam
Or on these pages
Linnik Microscope System system as designed
Breast Cancer Cell shows capture of dynamic cellular proceses
Rotifers examples of measured motion
Paramecium and Protozoa small moving critters
EMBC 2012 paper videos
Trade Magazine Articles and White Papers:
4D Phase Imaging Microscope White Paper 2010
Biophotonics Article 2012
Acknowledgements:
My main collaborator on this work was Goldie Goldstein, PhD (now at Nikon Research Corp of America).
This research was supported by:
NIH/NCRR 1R43RR028170-01, 2R44RR028170-02, and NIH/NIGMS 8 R44 GM103406-03
The work was performed at 4D Technology Corp and The University of Arizona.
Research Partners:
Erik Novak, Charlie Crandall, Neal Brock, and James Millerd,
4D Technology Corporation
Andy Rouse, Ron Lynch, Craig Weber, Jordan Lancaster, and Maki Niihori,
University of Arizona
Howard Letovsky,
Letovsky Dynamics
Jane Peppard, Joy Prisco, Erica Harnish, Elaine Powers,
Sanofi-Aventis Research Center, Tucson
Albert Kellner,
Sanford Burnham MRI, San Diego